Digital Manufacturing - Insights
SAP Digital Manufacturing Insights (DMi) is designed to elevate the efficiency and productivity of manufacturing processes. It offers an in-depth production data analysis, enabling manufacturers to understand their operations better. This tool aids in identifying areas for improvement, optimizing resource use, and enhancing overall production performance by transforming complex data into actionable insights.
Digital Manufacturing for Insights aims to provide an easy-to-consume and intuitive self-service manufacturing analytics platform that supports our customers’ expectation to analyze manufacturing data, having real-time visibility and transparency into the shop floor to fuel business decisions toward better efficiency in their operation and improved quality.
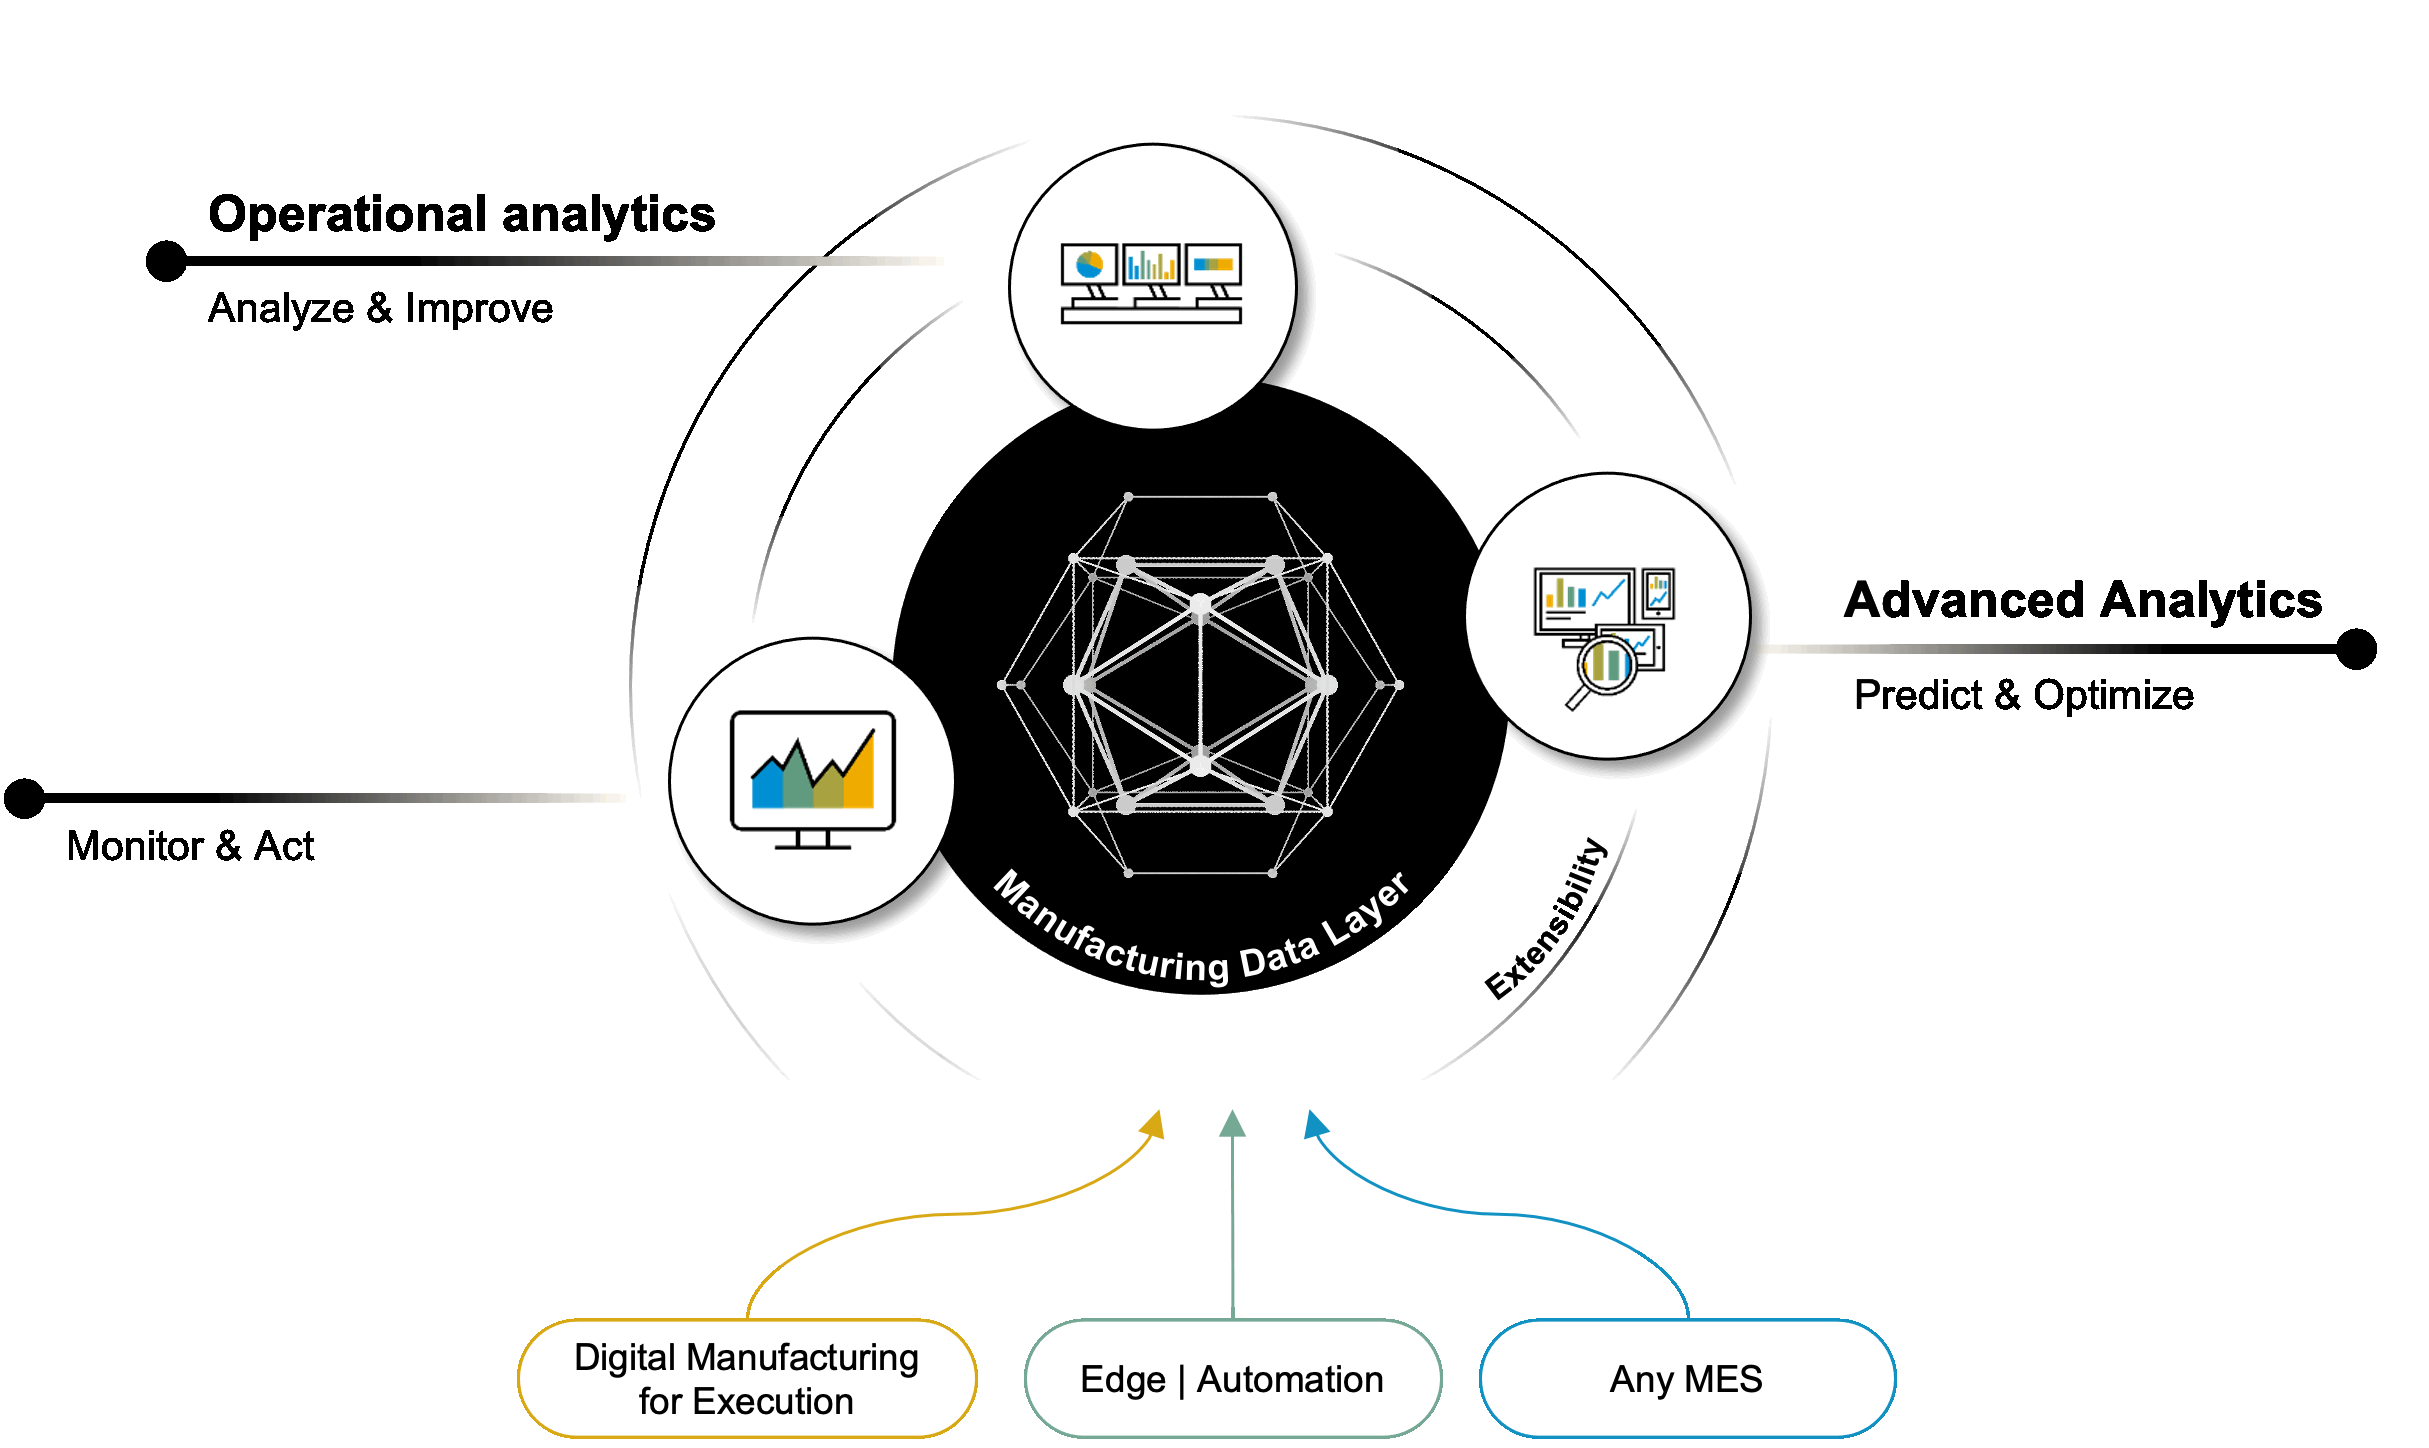
Foundation for Industrial Insights is the Manufacturing Data Layer:
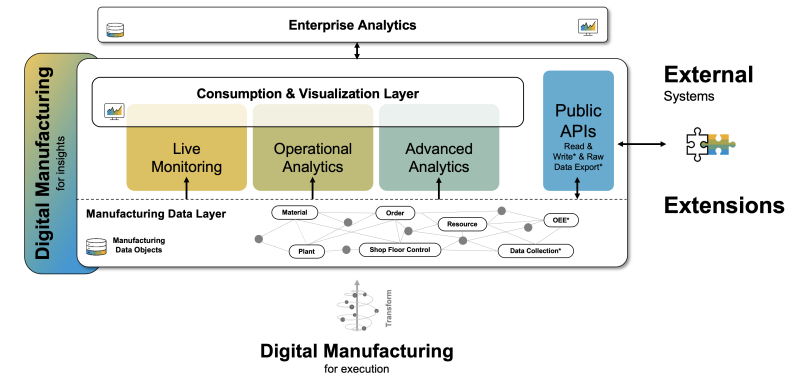
- With the new Manufacturing Data Layer, data from Digital Manufacturing for Execution is available in a single store in order to allow cross-plant data analysis and comparison. It is taking care of transforming & contextualizing processes, historians, and business data for analytical usage to enable customers to build analytical reports to draw useful information quickly.
- This harmonized data from multiple sources are stored into well-defined schema definitions called Manufacturing Data Objects (MDOs) comprised of Master Data, Transactional Data & Precalculated Data that enable business users to design and perform several queries and draw reports out of their manufacturing systems using embedded Analytics powered by SAP Analytics Cloud.
- It is evolving to an Open Platform that allows full read access to all DM information via APIs and, going forward, also writes APIs to send data from any data source into predefined MDOs.
On top of this foundation, all Industrial Insights / DMi capabilities are built:
- Live Monitoring with Line Monitor and Boards focusing on near real-time analytics, looking at the current day/current shift.
- .Operational analytics: Self-service environment to build all relevant manufacturing KPIs and dashboards on SAC technology embedded in DMi. Going forward, sample content is provided. Typical analytics: planned vs. actual quantities, scheduled vs. actual times, quality (good vs bad pieces)
- .Advanced Analytics: KPIs and analytics capabilities that are based on advanced logic, such as Overall Equipment Effectiveness, are provided with the application and can be consumed for live monitoring and operational analytics.

Key Principles: The focus of DMi goes beyond the pure visualization of data/KPIs and its interpretation; its vision is to gather data, interpret data to derive insights, and trigger actions based on the gained insights. (e.g. rescheduling)
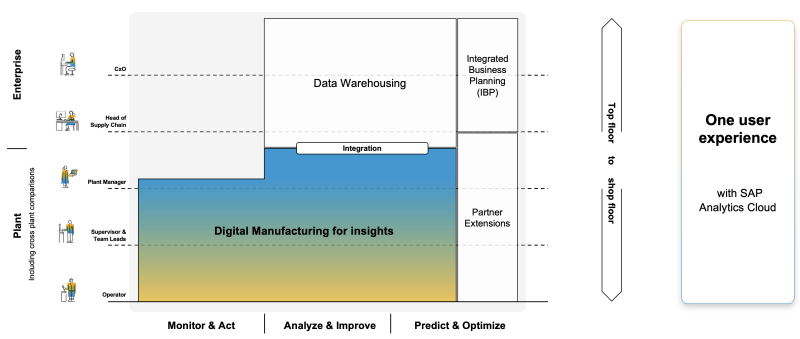
Industrial Insights focus: Operational manufacturing data within a plant. Aggregations beyond the plant and enrichment of data with additional data sources done in a Data Warehouse application such as SAP Data Warehouse Cloud. DMi/Industrial Insights offers live access to the data in this case.

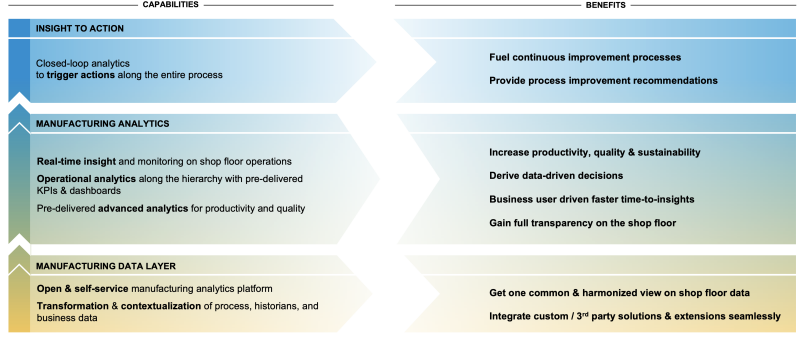
- Self-service manufacturing analytics with harmonized access for better visibility and extensibility
- Live production monitoring along the plant hierarchy and across multiple dimensions in real-time
- Operational analytics using KPIs & dashboards to drive data-driven decisions
- Pre-delivered advanced analytics to increase productivity, quality and sustainability
- Closed-loop analytics to trigger actions fueling a continuous improvement process
Digital system to gain real-time visibility of production performance with business context across the enterprise
- Gain insights on performance and productivity across different levels of the enterprise hierarchy (i.e., across regions, plants, work centers, resources, etc.)
- Make informed decisions by combining and utilizing data from shop floor systems and execution systems, along with contextual information from business sources (i.e., ERP)
- Use pre-delivered interactive dashboards filled with standardized key performance indicators (KPI) based on harmonized data
- Incorporate data from non-SAP sources, build customized KPI’s, and personalize your dashboards & reports
- Perform root cause analysis, drill -down and -up across different levels of the enterprise hierarchy

Analyze and optimize your digital operations
- Adaption to any manufacturing process & plant visibility and analytics for key performance indicators across a single plant or global operations
- Full integration to combined business, operational, and IoT data for improved and data-driven decisions
- Manage and view harmonized data for better visibility into your plant operations and leverage those insights to trigger actions along the entire process
- Live production monitoring along the plant hierarchy across multiple dimensions
- Manufacturing Performance Management with OEE, Energy Management, and operational performance indicators based on a self-service analytics platform
From the Plant Level down to the lowest production unit
- Use standard pre-delivered manufacturing sample KPIs fed with execution data on embedded SAC technology
- Gain real-time visibility and monitor the performance of the production process of all plants through geographic mapping
- Compare the performance between plants within and across regions, between work centers and resources
- Get quick visibility of personalized to identify non-performing plants
Deep Dive - KPI Analytics: Exploration of contributors
- Detailed analysis using KPI analytics application to identify contributors impacting the production performance
- Visibility of key areas impacting the performance of any selected KPI
- Drill down to find the root cause pointing to which material, work center, or order is causing the loss in KPI values
- Compare various KPIs across different nodes of the enterprise hierarchy
- Save the comparison result as a tile for instant access
Insights on Overall Equipment Effectiveness: Standard metric for measuring manufacturing productivity
- Measure productivity with standard pre-delivered OEE calculations
- Analytics on identified losses captured during execution
- Normalization of various losses into time lost
- Analyze OEE across a custom time range, across materials, and across shifts
- Root cause analysis for all OEE losses (availability, performance, and quality losses)
- Perform OEE comparison and loss analysis between work centers, resources, and plants across different time zones of the world
Root Cause Identifier for OEE Losses
- Helps to focus on the reasons for sub-optimal performance
- Root cause analysis for all OEE loss types, e.g., unscheduled down, schedule down, performance loss, and quality loss
- Identify major contributors to losses
- Multi-level reason code drill-down to identify the root cause of the issue
Live Production Visualization & Monitoring
- Seamlessly designed to your wish, the POD designer provides the details to monitor and track the production line from the Line Monitor plugins.
- Track the actual production progress against planned production with order-specific details from the perspective of “Production.”
- Monitor the yield, and scrap at every phase level of the order from the perspective of “Quality.” Embed IoT sensor data to help operators visually identify anomalies and correlate with specific orders.
- Visualize the resource availability summary and associated availability losses from the perspective of “Assets.”
- Monitor and track the effectiveness and performance from the perspective of “OEE.”
- Visualize shop floor 2D layout and overlay information on top

Alert Management
Alert Management – KPI Threshold Violation
- Visualize the alerts with appropriate filters
- Complete the alert lifecycle to make it to in-process, acknowledge, and complete
KPI violation
- Personalized subscription for alerts on KPI threshold breaches at any hierarchy node as per personal responsibility
Push Notification
- Contextualize view of alerts, categorized by date, type, and priority
- Push notification without refreshing the page
Data Engineering
Data Agents, Connections and Data Model for Analytical Insights
- Acquire data from on-premise systems (ME, ECC and S/4HANA) to the cloud (DMC)
- Enable data replication by defining data agents and connections for corresponding host systems
- Prepare and contextualize the replicated data for consumption by defining data models
- Ensure data integrity, continuity and completeness of replication
- Qualitatively monitor connectivity status and quantitatively monitor replication status
- Suspend and resume connectivity to the host system (e.g., in case of database maintenance)
- Suspend data replication and resume it from the delta load
SAP Analytics Cloud Integration
Manufacturing data in SAP Analytical Cloud (SAC)
- Set up a live connection from SAC to Digital Manufacturing Cloud for Insights
- Use DMC Insights KPIs in SAC stories and combine them with other data in the Digital Boardroom
SAC Stories in Dashboard Designer for Enhanced Insights
- Drag-and-drop SAC stories with ease into the dashboard designer
- Contextualize SAC story content with production performance management KPIs and content available from DMCi
- Leverage the complementary strengths of SAC and DMCi